
-1.svg)
A shopper opens a sofa's product page, turns the 3D model to check the back and armrests, then taps View in Augmented Reality (AR). The phone camera finds the floor, and the sofa appears in their living room at its real size. They walk around it, check the gap to the coffee table, and go back to the page to buy - or to pick another model.
That is AR product visualization in practice. It gives shoppers the one thing photos can't: a sense of how big a product is and how it looks in their own space.
This guide is for ecommerce managers, furniture and home brands, manufacturers, and product teams planning to add AR to product pages. It covers what the shopper actually sees, what you need to prepare, how to choose an implementation, and how to tell whether it's working.
TL;DR: What This Guide Covers
- The shopper flow: what happens between the product page and the camera view, and back.
- 3D assets: the files, materials, and product data an AR-ready model needs.
- Implementation options: WebAR, a dedicated app, or a custom build - and what each one costs you in friction and maintenance.
- Launch checklist: what to prepare and test before AR goes live.
- Measurement: which KPIs to track and how to test AR's impact without fooling yourself.
What Is AR Product Visualization?
AR product visualization places a 3D product model in a shopper's real environment through their device camera, at real-world scale. Depending on the product, it can sit on the floor, a tabletop, or a wall.
This gives shoppers a practical way to assess scale, proportions, finish, and context before continuing the purchase journey.

It is useful to separate AR product visualization from several related experiences:
| Experience | What it does |
| AR placement | Places a 3D product on a real floor, table, or wall through the camera. |
| Interactive 3D viewer | Lets shoppers rotate and zoom a 3D model directly on the product page. |
| Product configurator | Lets shoppers change colors, materials, components, or other options in 3D; the selected configuration can then open in AR. |
| Virtual try-on | Places products on the shopper’s face, body, or feet using face, body, or foot tracking |
| AI Room photo visualization | Lets shoppers upload a photo of their room and place products into the image. |
AR adds a digital object to a real environment. VR, by contrast, replaces the environment with a virtual scene; that distinction is all most ecommerce teams need for this implementation decision.
How AR Product Visualization Works on an Ecommerce Product Page
For the shopper, AR is a short detour from the product page and back. For the ecommerce team, it's a chain of product data, 3D files, and integrations that has to hold together for that detour to feel effortless.
The Shopper Experience
1. Explore the product
The shopper opens a product page and examines the product through images, specs, and, where available, an interactive 3D view.
2. Select product options
If the product is configurable, the shopper selects the available colors, materials, finishes, or other options. The AR view should show exactly the version they selected.
3. Start AR
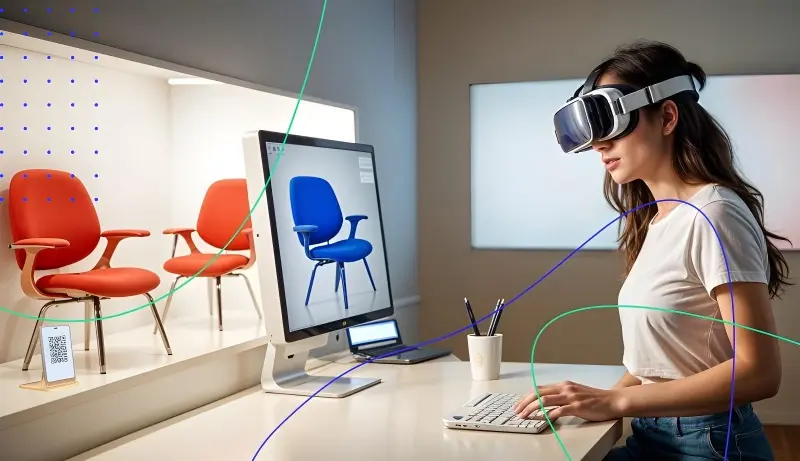
The shopper taps View in AR or a similar button. On desktop, the page can show a QR code to continue on a phone.
4. Place the product
The camera opens and detects a surface - the floor, a tabletop, or a wall. The shopper places the product at its real size, then moves or rotates it to check position and proportions.
Note: many AR viewers let shoppers pinch to resize the model by default. The experience should use a controlled scale based on the product's actual dimensions. Allowing unrestricted scaling can make AR useful for visual placement while making it less reliable for judging real-world size.
5. Continue shopping
When the shopper leaves AR, they return to the same product and variant on the Product Detail Page (PDP), ready to add it to the cart or compare another option.

Behind the Experience
Behind those five steps is a chain of work: product data becomes an optimized 3D model, the model is exported in the formats each platform needs, every variant is mapped to its SKU, and a viewer on the PDP hands the right version to the device's AR mode. If any link breaks, the shopper notices - as the wrong size, the wrong fabric, or a button that doesn't work. The checklist below covers each part.
What You Need to Launch AR Product Visualization
Most AR problems shoppers notice — wrong size, flat-looking materials, slow loading, or the wrong variant appearing in the camera view — are decided long before launch. Use this checklist to identify what is ready and what still needs work.
Product Data and Reference Materials
Start with accurate dimensions for every product you plan to show in AR. Collect existing references: CAD files, technical drawings, product photos from several angles, and physical material samples or swatches for fabrics and finishes.
AR-Ready 3D Assets
AR models need to be accurate enough to trust and light enough to load on a mid-range phone. That usually means:
- GLB/glTF and USDZ files. glTF (and its single-file binary version, GLB) is the open format used for web 3D and Android AR. USDZ is required for AR Quick Look on Apple devices. Some platforms generate USDZ from glTF automatically, others expect you to supply both.
- PBR materials. Physically based rendering (PBR) maps help wood, metal, fabric, glass, and painted surfaces respond consistently to light.
- Optimized geometry and textures. Polygon count, texture resolution, and file size all affect loading time and stability.
If you don't have 3D models yet, a 3D product modeling service can build AR-ready models from your product data and references.
Variant and SKU Mapping
If a sofa comes in six fabrics, the shopper should see the fabric they selected - both in 3D and in AR. Define which 3D model belongs to which sellable product and which material or visual choices map to valid variants.
PDP Integration
- A clear entry point. Place the View in AR button close to the product media, where shoppers are already looking at the product. Label it plainly.
- Viewer-to-AR connection. The 3D viewer or configurator on the page should launch AR with the same product and variant.
- Desktop handoff. Show a QR code on desktop so shoppers can continue on their phone.
Device Testing and Fallbacks
AR support depends on the device, operating system, and browser. Test on a representative set of iOS and Android devices, including older and mid-range models. Decide what unsupported devices see: typically the interactive 3D viewer without the AR button, rather than a button that fails.
Analytics
Set up tracking before launch. At minimum, track when shoppers open the 3D viewer, tap View in AR, successfully place the product, exit AR, or encounter a failed launch. This helps distinguish low shopper interest from technical issues.
Catalog Updates
Products change over time: new colors, materials, variants, and seasonal collections are added while others are discontinued. Keep your 3D catalog in sync with your ecommerce catalog: add or update the assets and variant mappings needed for new products, and remove outdated variants from the 3D experience.
WebAR vs App-Based AR vs Custom AR Implementation
AR can reach shoppers through a browser, a dedicated mobile app, or a custom implementation built with AR frameworks and APIs. The main difference is not what AR can do, but where the experience lives, how much friction it creates for shoppers, and how much development and maintenance it requires from your team.
A note on ARKit and ARCore: these are Apple's and Google's frameworks for building AR experiences. They are not separate delivery options — they are toolkits used within app-based and custom implementations. Browser-based AR can also rely on the underlying AR capabilities provided by the device and operating system.
| Criteria | Browser-based WebAR | Dedicated mobile AR app | Custom build with SDKs and APIs |
| Shopper friction | Low: shoppers launch AR from the product page without installing an app. |
Higher: shoppers must find, install, and update the app. |
Depends on how the team designs the experience. |
| Device reach | Compatible mobile devices and browsers; support varies by OS, browser, and device. |
Limited to the brand’s app users and supported devices. | Depends on the chosen web, app, and device strategy. |
| Capabilities | 3D viewing, real-space placement, QR handoff from desktop, and basic product-page integration. |
Can support richer app-specific features, such as multiple products in one scene, saved content, or deeper device integration. | Maximum control over UI, product logic, catalog integrations, and specialised interactions. ARKit and ARCore are tools used to build this type of solution. |
| Who builds and maintains it | Usually the platform or vendor. |
Your team or agency, for every OS update. |
Your team, fully. |
| Catalog integration | Via PDP embed and catalog connection. |
Requires app catalog and sync. |
Custom integration with PIM, ERP, or commerce backend. |
| Asset updates | Upload or replace models in one place. |
Tied to app content pipeline. |
Your own pipeline. |
| Best fit | Most ecommerce catalogs, especially furniture and home products. |
Brands whose customers already shop in their app. |
Unique experiences that off-the-shelf tools can't support. |
The right approach depends on your existing ecommerce experience and what you need AR to do.
If shoppers should be able to launch AR directly from a product page with minimal friction, browser-based WebAR can be a practical fit. A dedicated app makes more sense when AR is part of a broader mobile experience, while a custom implementation gives you more control when your product logic, integrations, or AR interactions require capabilities that an off-the-shelf solution does not provide.
Where AR Product Visualization Works Best
AR is most useful when shoppers need more information than standard product images can provide — especially when size, proportions, appearance, or context are difficult to judge online.
Research supports this idea. A Journal of Marketing study by Tan, Chandukala, and Reddy analyzed AR use at an international cosmetics retailer and found that its sales impact was stronger for less popular brands, products with narrower appeal, higher-priced products, and customers who were new to the category.
Furniture and Home Décor
This is the central AR placement use case. Shoppers can assess a product’s scale, proportions, finish, and relationship to the room before purchase.
IKEA Place, launched in 2017, made this scenario widely known: true-to-scale furniture placed in the shopper's room through an app. Today the same flow typically runs in the browser, straight from the product page.
Consumer Electronics
AR can help assess a television’s wall position, a speaker’s footprint, or an appliance’s relationship to surrounding furniture. It is a preview, not a substitute for installation requirements, cable routing, power clearance, or compatibility documentation.
For example, Apple's MacBook Pro page includes a View in your space link that opens the laptop in AR Quick Look. Shoppers can check how it looks on their own desk and how much room it takes up - straight from the product page, without installing an app.
Configurable Products
When a product comes in many colors, materials, or finishes, AR is most useful after configuration: the shopper picks their fabric and leg finish, then sees that exact version in the room. This depends on the variant handling described earlier.
Virtual Try-On
Trying on makeup, glasses, or shoes relies on face, body, or foot tracking, not on placing a model on a surface. Tools like L'Oréal's ModiFace belong to this category. It solves a real problem for beauty and fashion, but it needs different technology, different assets, and usually a different vendor than furniture placement.
 Source: Ditar
For a broader look at how AR is used across ecommerce categories, see our overview of augmented reality in ecommerce.
How to Measure AR Product Visualization
Track what happens after shoppers interact with AR: do they continue shopping, add the product to cart, buy it, and eventually return it? Use these results together with technical data to see where AR is working and where it needs improvement.
KPIs to Track
Start with the AR funnel, then connect it to your ecommerce data.
| KPI | Formula | Why it matters |
| View-to-AR rate |
Sessions with an AR tap ÷ sessions viewing an AR-enabled PDP |
Shows whether shoppers notice and want AR |
| Successful AR launch rate |
Sessions where the product was placed ÷ sessions with an AR tap |
Separates technical failures from lack of interest |
| AR engagement |
Median time in AR; share of sessions with move or rotate actions |
Shows whether shoppers actually evaluate the product |
| Add-to-cart after AR |
Sessions with add-to-cart after AR ÷ sessions with successful AR |
Links AR to the next purchase step |
| Purchase rate |
Orders ÷ sessions, compared between test groups |
The core business outcome |
| Return rate |
Returns ÷ orders for comparable products or cohorts |
Shows whether return behavior differs between comparable groups |
| AR failure rate by device/browser |
Failed launches ÷ AR taps, split by device, OS, and browser | Finds where the experience breaks |
In GA4, standard ecommerce events such as view_item, add_to_cart, and purchase can be combined with custom events for AR. Events such as ar_launch, ar_placed, ar_failed, and ar_exit can be used for this purpose. These are implementation suggestions, not GA4 standards.
Testing and Interpretation
Shoppers who open AR are usually more engaged to begin with. They would likely convert at a higher rate even without AR, so a simple AR vs non-AR comparison overstates the effect.
A cleaner approach is an A/B test at the page level: show the AR entry point to one group of visitors and not to the other, then compare the whole groups - including visitors in the AR group who never tap the button.
How long to run the test depends on your traffic, baseline conversion rate, and the size of effect you want to detect. A small lift on a low-traffic furniture page can take months to measure reliably; use a sample size calculator before you start, and run the test for full weekly cycles. Returns need an even longer window, because they arrive weeks after purchase.
ROI Calculation
Calculate AR ROI from incremental profit rather than revenue. Additional sales also bring product, shipping, fulfillment, and other variable costs.
- Incremental orders = (treatment conversion rate - control conversion rate) × treatment sessions
- Incremental gross profit = incremental orders × average order value × contribution margin
- Return savings = (control return rate - treatment return rate) × treatment orders × net cost per return
- Total AR cost = 3D asset creation + platform or hosting fees + integration + ongoing maintenance, over the same period
- Incremental profit = incremental gross profit + return savings - total AR cost
- ROI = incremental profit ÷ total AR cost
Net cost per return is the actual cost of processing a return, including shipping, handling, repackaging, and any write-downs. It should not be calculated using the product's full selling price.
AR Product Visualization Implementation Checklist
Most AR product visualization software looks similar in a demo: a chair appears on a floor. The differences show up later — in how assets are produced, how variants connect to your catalog, and who maintains the experience as your store and devices change.
These are the questions to ask before you choose a solution.
1. Does the vendor provide 3D modeling services?
Check whether the vendor creates or optimizes 3D assets for you, or requires production-ready models. Also clarify what source files they can work from, who owns the final assets, and whether you can reuse them for renders, 3D viewers, configurators, or other experiences.
2. Does the solution support your products and variants?
If you are considering a configurator, check which product options can be made configurable — such as materials, colors, components, or other product-specific options. Ask the vendor to show examples with products similar to yours and explain how different configurations are handled.
3. How is the digital product catalog set up and managed?
Ask whether the vendor can set up the catalog for you or whether your team needs to handle the setup and ongoing configuration. Check how many product variants and configuration options the system can support, and ask to see the CMS dashboard to understand how easy it is to manage products, variants, materials, and pricing yourself.
4. How does it fit into your PDP and ecommerce stack?
Is there a ready integration for your platform, or does it require custom development? How much control do you have over where the AR button appears and how it's labeled?
5. Which devices, browsers, and AR modes are supported?
Ask specifically about iOS and Android, floor and wall placement, and whether the selected variant carries into AR on both platforms.
6. What is included in the pricing?
Check whether pricing is based on products, sessions, views, or a subscription plan. Clarify whether 3D modeling, hosting, support, and ongoing maintenance are included or charged separately.
AR Product Visualization with Zolak
Zolak adds AR to ecommerce product pages through two components, depending on your products.
3D Viewer with built-in AR is for fixed products and individual SKUs. The shopper explores the product in 3D on the PDP, taps the AR button, and places it in their space.
AR Product Configurator is for configurable products with options. The shopper selects the available color, material, or finish in 3D, then opens that exact configuration in AR.
In both cases, AR runs in supported mobile browsers on iOS and Android, with no app to install. On desktop, a QR code lets shoppers continue on their phone. On devices that don't support AR, shoppers can still explore the product in 3D.
The same 3D assets can also be used across other Zolak tools, such as Zolak Studio for product imagery.
From One Product to the Whole Room
AR answers whether one product fits. Furniture shoppers often need more: how the sofa, rug, and coffee table work together. Zolak Showroom lets them place multiple catalog products into a photo of their own room, try combinations, and plan the full space, even when they aren't at home. It complements AR rather than replacing it, and gives brands a natural way to surface complementary products.
See How Zolak Adds AR to Ecommerce Product Pages
Bring a few products from your catalog. We'll show how they could work in 3D and AR, what assets you'd need, and how the setup fits your store. Book a Demo with Zolak today.